← Every exhibit
The loss has an address
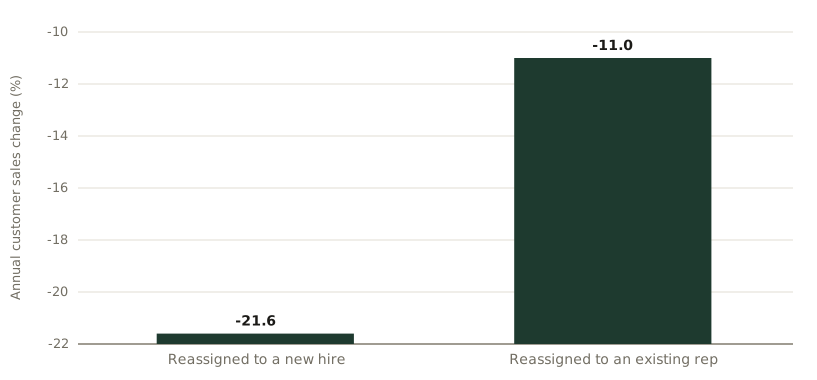
Annual customer sales change after a salesperson departure, by replacement type. The existing-rep figure is statistically indistinguishable from zero.
Reference & Evidence
Source: Shi, Sridhar, Grewal & Lilien (2017), Table 10: difference-in-differences estimates transformed as e^b−1; 830 disrupted customers against 1,615 matched controls at one Fortune 500 U.S. electrical-components distributor, noncompete in force. One firm; a disruption cost, not a defection cost.
Each line is a claim from the register this journal publishes against, resolved from the register at build time.
- A The reassignment losses, verbatim: "Customers reassigned to new hires exhibited a 21.6% sales loss, and those reassigned to existing sales reps exhibited an 11.0% sales loss", and the authors report the decay too: "for new hires, 12.5% sales loss over ten quarters vs. 21.6% for one year" Shi, Sridhar, Grewal & Lilien (2017), Table 10 ·
SSGL17-C2 - A The setting carries a legal constraint that bounds every reading of the result: "A noncompete agreement prevents departing sales reps legally from taking any" customers with them if they are hired by a competitor Shi, Sridhar, Grewal & Lilien (2017), data section ·
SSGL17-C5
Grades: A, verified against the printed page of the primary source · B, primary source, text layer only · C, authoritative secondary · D, reported.