The story that retained was not the licensed one
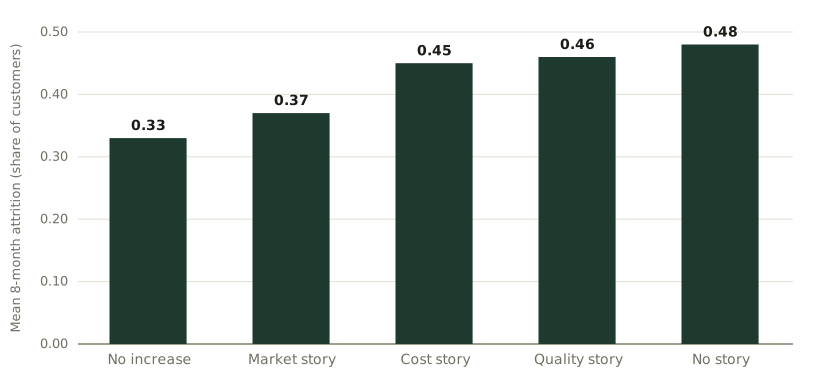
Share of customers gone within eight months of a price-increase notification, by the justification attached to it.
Reference & Evidence
Source: Damavandi (2024), Figure 3: mean eight-month attrition by announcement arm; dissertation version (n=1,655) of a study in press at the Journal of Marketing (which reports n=1,626). One Canadian self-storage provider, monthly consumer subscriptions with a small business segment; increases of 5% and 15% pooled per arm. Directional evidence from one setting; not a portable rate.
Each line is a claim from the register this journal publishes against, resolved from the register at build time.
- A Field experiment (dissertation version): an increase raised 8-month exit risk 47.7%; market justification cut exit risk 44.8%; cost and quality null campaign (dissertation archived, Scholaris 20.500.14721/37592) ·
DAK26-C1 - A Per-arm 8-month attrition: 0.33 none / 0.37 market / 0.45 cost / 0.46 quality / 0.48 no story (diss. Fig. 3) campaign (dissertation archived, Scholaris 20.500.14721/37592) ·
DAK26-C2
Grades: A, verified against the printed page of the primary source · B, primary source, text layer only · C, authoritative secondary · D, reported.
Related exhibits
-
The increase, designed against the record
From the essay The price increase is judged before it is paid.
-
The cap you assume is mostly not written down
From the essay The price increase is judged before it is paid.
-
Judged, then paid: what is measured where
From the essay The price increase is judged before it is paid.