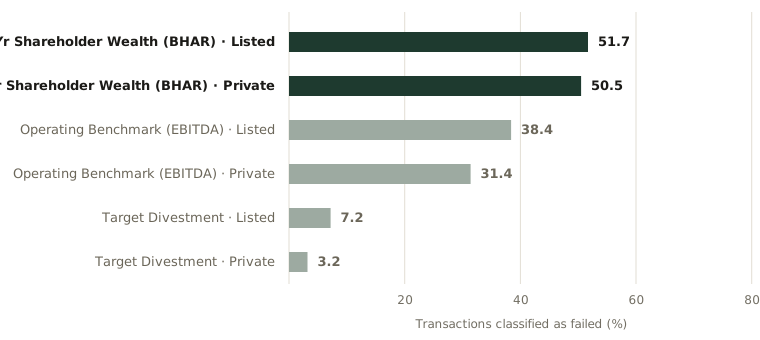
European M&A failure rates by criterion
Failure rates across three objective criteria for European listed and private targets. Value destruction sits at roughly half on stock returns, drops to roughly one-third on operating cashflow, and is single-digit on divestments.
Reference & Evidence
Source: Craninckx & Huyghebaert (2011), Table 3: 773 European M&A transactions (1997–2006): 401 listed-acquirer/listed-target deals and 372 listed-acquirer/private-target deals. Shareholder wealth measured via 2-year BHAR against size/BTM/momentum controls; operating performance benchmarked via Gugler et al. (2003) model; divestments tracked in Zephyr.
Each line is a claim from the register this journal publishes against, resolved from the register at build time.
- A Sample A and Sample B, verbatim: "more than half (51.7%) of the transactions in Sample A destroyed shareholder value up to two years following deal completion", and in Sample B "50.5% of acquirers exhibit inferior stock performance" Craninckx & Huyghebaert (2011), Table 3 ·
CH11-C1 - A "approximately 38.4% of these M&As resulted in an abnormal operating performance decrease during that window" for listed targets; "31.4% of firms realize inferior operating performance" for private ones Craninckx & Huyghebaert (2011), Table 3 ·
CH11-C2 - A The divestment rate is the small one: "in only about 7.2% of the cases, the acquiring management decided to sell off a majority stake in the target after the deal was closed", against "about 3.2%" in the private-target sample Craninckx & Huyghebaert (2011), Table 3 ·
CH11-C3 - A Across criteria, European M&A failure rates run "roughly between 38% and 53%" for listed targets Craninckx & Huyghebaert (2011), section 5 ·
CH11-C4
Grades: A, verified against the printed page of the primary source · B, primary source, text layer only · C, authoritative secondary · D, reported.
Related exhibits
-
The failure rate across folklore and empirical evidence
From the essay The European failure number nobody quotes
-
The deal governance audit
From the essay The European failure number nobody quotes
-
Accumulation versus activity, indexed over twelve quarters
From the essay Why growth compounds, and activity doesn't.