← Every exhibit
Three outcomes, three evidence paths
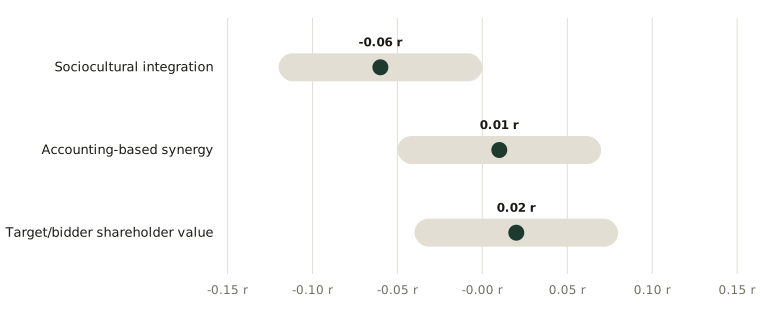
The meta-analysis separates sociocultural integration, accounting-based synergy, and shareholder value. Confidence intervals crossing zero highlight that financial performance does not guarantee cultural collaboration.
Reference & Evidence
Source: Author's synthesis of meta-analytic correlations from Stahl and Voigt (2008), 46 M&A studies (n = 10,710). Points show sample-weighted mean correlation r; bands show estimated 95% confidence intervals. The chart keeps outcome domain boundaries explicit.
Related exhibits
-
The evidence boundary around scenario planning
From the essay Scenario planning starts when a trigger moves a resource
-
Three evidentiary levels for brand reaction
From the essay Mixed reactions are not brand polarization
-
The synthetic parallel-trends screen
From the essay What are parallel trends? The assumption behind difference-in-differences