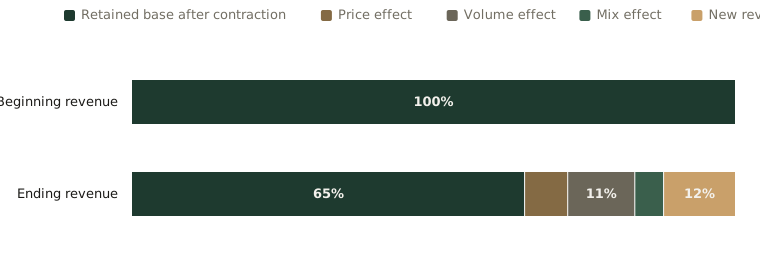
The synthetic revenue growth management composition
A revenue composition is a starting ledger. Keep retained base, price, volume, mix, new business, cost, and residual boundaries explicit before calling growth healthy.
Reference & Evidence
Source: Author's synthetic composition grounded in Variance Works (2026) and Maglaras and Meissner (2006). Values are illustrative, not company data, a margin benchmark, or a causal estimate.
Each line is a claim from the register this journal publishes against, resolved from the register at build time.
- C "price volume and mix analysis how to explain a revenue gap": a vendor method page, walking from baseline revenue to current revenue through named effects Variance Works. (2026). Price volume and mix analysis explained captured 2026-09-06 ·
VWM26-C1 - C "for each product sold in both periods the price change multiplied by the units sold today valuing it at current volumes is a convention": the page says so itself: a convention, not a law Variance Works. (2026). Price volume and mix analysis explained captured 2026-09-06 ·
VWM26-C2 - C The same page states the arithmetic constraint: "the effects must add up to the observed change exactly if they do not the bridge is wrong and should say so" Variance Works. (2026). Price volume and mix analysis explained captured 2026-09-06 ·
VWM26-C3 - C The five effects are enumerated on the page, beginning "the five effects price effect what changed because you sold at different prices" Variance Works. (2026). Price volume and mix analysis explained captured 2026-09-06 ·
VWM26-C4 - A The model, verbatim: "a firm that owns a fixed capacity of a resource that is consumed in the production or delivery of multiple products" maglaras-meissner-2006-dynamic-pricing-revenue-management ·
MM06-C1 - A Two variants, not one: "we consider two well studied variants of this problem": price-setting under market power, and capacity control at fixed prices maglaras-meissner-2006-dynamic-pricing-revenue-management ·
MM06-C2 - B Revenue growth management is a cross-functional system for reconciling growth and margin decisions at a declared commercial boundary Author framework grounded in VWM26-C1 and MM06-C1 ·
G05-OWN-C1 - B Revenue growth management, PVM analysis, revenue management, pricing architecture, and contribution margin are related but distinct objects Author taxonomy grounded in VWM26-C1 and MM06-C1 ·
G05-OWN-C2 - B A revenue composition reconciles a beginning base to an ending base under declared components, but a compact retained-base block may hide material negative lines Author framework grounded in VWM26-C1 to VWM26-C4 ·
G05-OWN-C4
Grades: A, verified against the printed page of the primary source · B, primary source, text layer only · C, authoritative secondary · D, reported.
Related exhibits
-
The signed effects in a synthetic PVM bridge
From the essay What is price-volume-mix analysis? Separate price from what was sold
-
Which control is doing the work?
From the essay Revenue management versus dynamic pricing
-
The revenue-management control record
From the essay Revenue management versus dynamic pricing