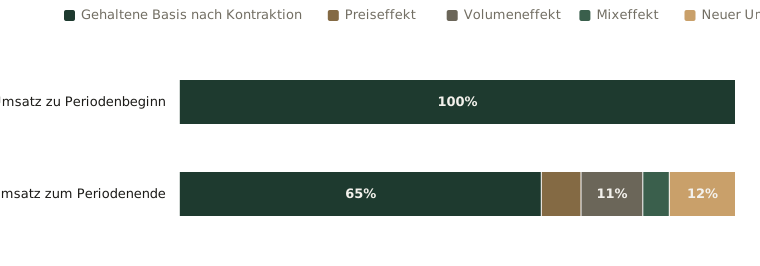
Die synthetische Revenue-Growth-Management-Zusammensetzung
Eine Umsatzzusammensetzung ist ein Startledger. Halten Sie Basis, Preis, Volumen, Mix, Neugeschäft, Kosten und Residuum sichtbar, bevor Wachstum als gesund bezeichnet wird.
Referenz & Evidenz
Quelle: Synthetische Zusammensetzung des Autors auf Grundlage von Variance Works (2026) sowie Maglaras und Meissner (2006). Werte sind illustrativ, keine Unternehmensdaten, kein Margenbenchmark und keine Kausalschätzung.
Jede Zeile ist eine geprüfte Aussage aus dem Prüfregister des Journals, beim Build aus dem Register aufgelöst. Das Register wird auf Englisch geführt.
- C "price volume and mix analysis how to explain a revenue gap": a vendor method page, walking from baseline revenue to current revenue through named effects Variance Works. (2026). Price volume and mix analysis explained captured 2026-09-06 ·
VWM26-C1 - C "for each product sold in both periods the price change multiplied by the units sold today valuing it at current volumes is a convention": the page says so itself: a convention, not a law Variance Works. (2026). Price volume and mix analysis explained captured 2026-09-06 ·
VWM26-C2 - C The same page states the arithmetic constraint: "the effects must add up to the observed change exactly if they do not the bridge is wrong and should say so" Variance Works. (2026). Price volume and mix analysis explained captured 2026-09-06 ·
VWM26-C3 - C The five effects are enumerated on the page, beginning "the five effects price effect what changed because you sold at different prices" Variance Works. (2026). Price volume and mix analysis explained captured 2026-09-06 ·
VWM26-C4 - A The model, verbatim: "a firm that owns a fixed capacity of a resource that is consumed in the production or delivery of multiple products" maglaras-meissner-2006-dynamic-pricing-revenue-management ·
MM06-C1 - A Two variants, not one: "we consider two well studied variants of this problem": price-setting under market power, and capacity control at fixed prices maglaras-meissner-2006-dynamic-pricing-revenue-management ·
MM06-C2 - B Revenue growth management is a cross-functional system for reconciling growth and margin decisions at a declared commercial boundary Author framework grounded in VWM26-C1 and MM06-C1 ·
G05-OWN-C1 - B Revenue growth management, PVM analysis, revenue management, pricing architecture, and contribution margin are related but distinct objects Author taxonomy grounded in VWM26-C1 and MM06-C1 ·
G05-OWN-C2 - B A revenue composition reconciles a beginning base to an ending base under declared components, but a compact retained-base block may hide material negative lines Author framework grounded in VWM26-C1 to VWM26-C4 ·
G05-OWN-C4
Prüfgrade: A, gegen die gedruckte Seite der Primärquelle geprüft · B, Primärquelle, nur Textebene · C, belastbare Sekundärquelle · D, berichtet.
Verwandte Abbildungen
-
Die signierten Effekte einer synthetischen PVM-Brücke
Aus dem Beitrag Was ist eine Preis-Volumen-Mix-Analyse? Preis von dem trennen, was verkauft wurde
-
Welche Steuerung arbeitet hier?
Aus dem Beitrag Revenue Management versus dynamische Preisgestaltung
-
Das Steuerungsprotokoll für Revenue Management
Aus dem Beitrag Revenue Management versus dynamische Preisgestaltung