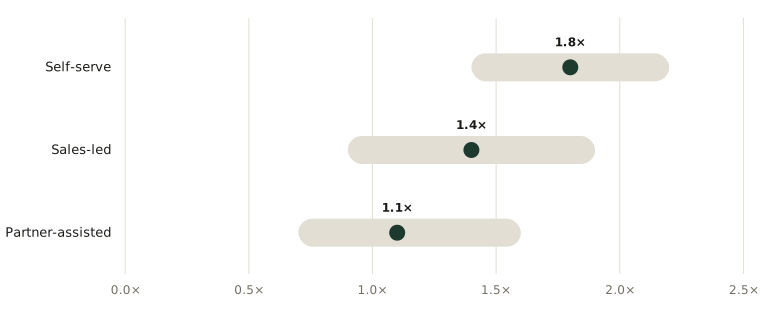
Synthetic GTM efficiency ranges
Compare GTM motions only after output, resource denominator, maturity, capacity, and attribution boundary are declared. The central point is not a universal target.
Reference & Evidence
Source: Author's synthetic GTM efficiency sensitivity model grounded in Homburg, Vomberg and Muehlhaeuser (2020) and Biemans, Malshe and Johnson (2022). Ranges vary declared output, resource, maturity, and allocation assumptions; they are not benchmarks.
Each line is a claim from the register this journal publishes against, resolved from the register at build time.
- B Go-to-market efficiency is a declared output-to-resource ratio for a named motion and period Author framework grounded in CH1R-C1 and BMJ22-C1 ·
G06-OWN-C1 - B Output, resource denominator, motion, period, maturity, capacity, and attribution must be visible before motions are compared Author record design ·
G06-OWN-C2 - B GTM efficiency can be represented as declared output divided by declared GTM resource cost Author formula ·
G06-OWN-C3
Grades: A, verified against the printed page of the primary source · B, primary source, text layer only · C, authoritative secondary · D, reported.
Related exhibits
-
What does go-to-market efficiency measure?
From the essay What is go-to-market efficiency? The denominator across growth and capacity
-
What does a GTM efficiency range look like?
From the essay What is go-to-market efficiency? The denominator across growth and capacity
-
How is GTM efficiency different from MER or ROAS?
From the essay What is go-to-market efficiency? The denominator across growth and capacity