← Every exhibit
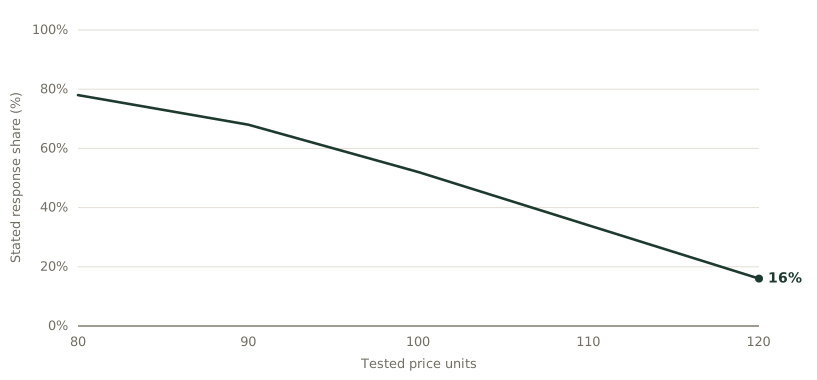
The synthetic Gabor-Granger intent curve
A price-point response curve is evidence about answers under a prompt. It becomes commercially useful only after choice, budget, channel, and transaction validation.
Reference & Evidence
Source: Author's synthetic price-point illustration bounded by Urban, Weinberg and Hauser (1996) and Aydin, Kwong, Ji and Law (2014). The response shares are illustrative stated-intent values, not observed purchases, market demand, or a price recommendation.
Each line is a claim from the register this journal publishes against, resolved from the register at build time.
- A The concern is stated preference inflating under hype: the authors worried that "respondents overstated their willingness to purchase an environmentally sound car" and built the design around it. It is one electric-vehicle case in which "the authors describe how one firm combines managerial judgment" with market measurement, not a general law Urban, Weinberg & Hauser. (1996) ·
UWH96-C1 - A The paper's actual claim is about FUZZINESS, not a survey-versus-choice-model comparison: "a high degree of fuzziness always exists in the data obtained from conjoint surveys" and "ignorance of the fuzziness would lead to the over-estimation of market demands" Aydin, Kwong, Ji & Law. (2014) ·
AKJL14-C1 - B Gabor-Granger pricing research asks respondents to evaluate purchase intention across a sequence of stated price points Author framework; direct method source not held ·
T05-OWN-C1 - B A stated purchase-intent curve is not a market-price observation, transaction price, or revealed willingness to pay Author boundary grounded in UWH96-C1 and AKJL14-C1 ·
T05-OWN-C2 - B Price-point acceptance, purchase intention, and observed purchase are separate response objects Author taxonomy ·
T05-OWN-C4 - B The method can compare stated acceptance across price points under its survey design, but cannot by itself estimate realized demand or causal elasticity Author negative boundary ·
T05-OWN-C5
Grades: A, verified against the printed page of the primary source · B, primary source, text layer only · C, authoritative secondary · D, reported.