← Every exhibit
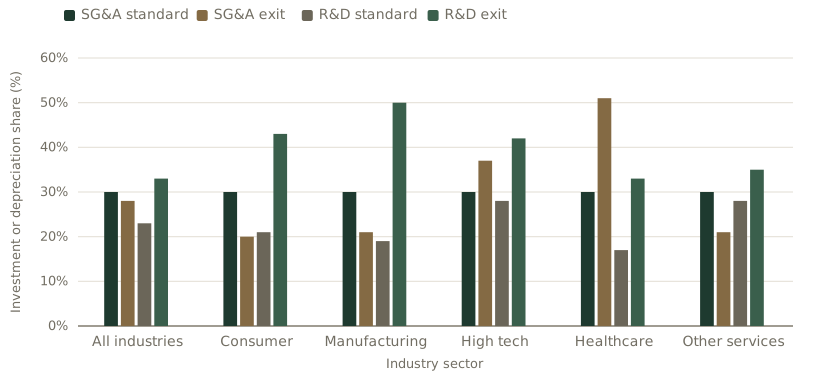
The measured investment share of SG&A by industry
Comparison of standard BEA-HH assumptions versus empirical market-based exit parameters across major industries.
Reference & Evidence
Source: Data from Ewens, Peters & Wang (2019, revised October 2023), NBER Working Paper No. 25960, Table 1 (p. 47).
Each line is a claim from the register this journal publishes against, resolved from the register at build time.
- A R&D depreciation is estimated, not assumed, and it moves with R&D intensity: "we find a significantly higher depreciation rate for the two industries with the highest R&D intensity: healthcare (33% vs 17%) and high-tech (42% vs 28%)" Ewens, Peters & Wang (2019, revised 2023), Table 1 ·
EPW24-C5 - A The SG&A share is the number the 30% rule stands on, and the paper states both the estimate and its spread: "we find that our 28% estimate of the fraction of SG&A representing invested capital is similar to that used in earlier work (30%)", while "this ratio varies dramatically across industries, from 20% (consumer) to" 51% (healthcare) Ewens, Peters & Wang (2019, revised 2023), Table 1 and section 1 ·
EPW24-C6
Grades: A, verified against the printed page of the primary source · B, primary source, text layer only · C, authoritative secondary · D, reported.
Related exhibits
-
Every published depreciation rate, and what it was measured on
From the essay Every growth budget is a gross number
-
Commercial budgeting matrix: operating cost vs capital creation
From the essay The thirty-percent rule for sales and marketing
-
Which empirical transfer test must precede deploying a predictive model across cohorts?
From the essay One customer model cannot predict every outcome