← Every exhibit
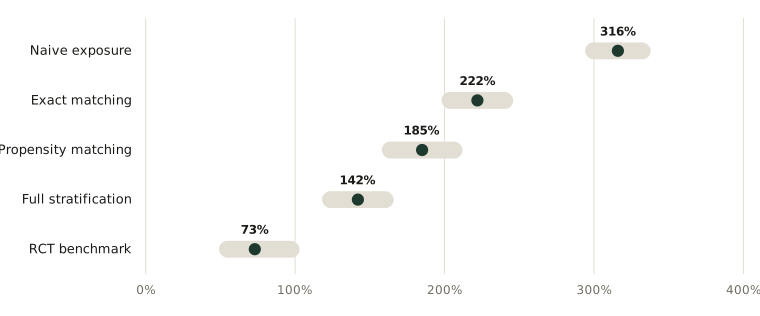
Estimated treatment effect (ATT) on checkout conversions across model specifications
Comparing observational model specifications against the true experimental randomized controlled trial benchmark.
Reference & Evidence
Source: Gordon et al. (2019), Marketing Science 38(2), §7.
Each line is a claim from the register this journal publishes against, resolved from the register at build time.
- B The randomized benchmark, with its interval: "this implies the ATT lift was 73%", and "the 95% bootstrapped confidence interval for this lift is [49%, 103%]" Gordon et al. (2019), section 7.1 ·
GORDON19-C6 - B The naive comparison, and the authors' own reading of it: exposed and unexposed conversion of 0.061% against 0.019%, "implying an ATT lift of 316%. This estimate represents the combined lift due to treatment and selection and is more than four times the lift due to treatment of 73%" Gordon et al. (2019), section 7.2 ·
GORDON19-C7 - B Matching on demographics is not enough: "exact matching on age and gender alone performs poorly, yielding a lift of 222%" Gordon et al. (2019), section 7.2.1 ·
GORDON19-C8
Grades: A, verified against the printed page of the primary source · B, primary source, text layer only · C, authoritative secondary · D, reported.