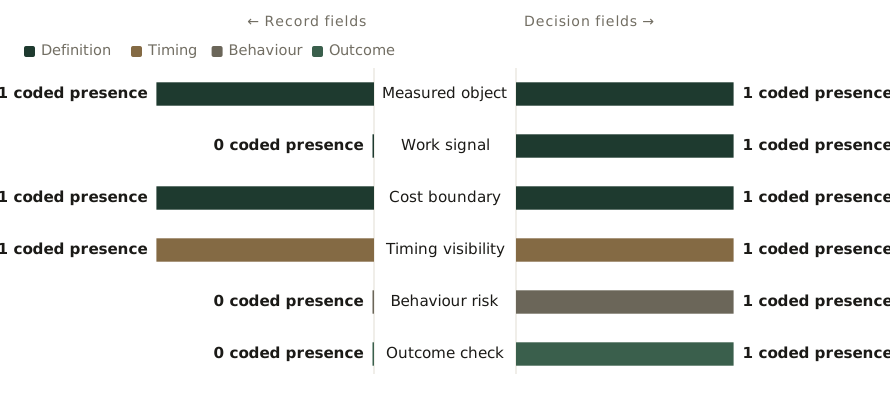
From measured object to outcome check
A usable compensation base connects the measured object to work, timing, control, behaviour, and an outcome test without treating them as one number.
Reference & Evidence
Source: Author's schematic presence coding grounded in the measurement and behavioural boundaries described by Cassidy and Wischkaemper (1959), Sabnis et al. (2013), and Oyer (1998). Values are coded process presence, not observed impact or company data.
Each line is a claim from the register this journal publishes against, resolved from the register at build time.
- B The scope is nine purposively selected firms in 1959: "Case studies were made of nine selected wholesaling firms whose annual sales to food service operators ranged from slightly less than" one million dollars to almost five million, which is a historical description and not a benchmark cassidy-wischkaemper-1959-institutional-wholesale-grocers ·
CW59-C6 - A The sample, from the paper: "we received 562 surveys for a response rate of" 21.08%, "we retained 500 usable responses", and the analysis uses "data from 461 sales reps from four firms". The 70% in the same abstract is guarded by FUN-X1 and never travels with this row Sabnis et al. (2013) ·
SCCL13-C1 - A The compensation context, verbatim: "The compensation schemes in all four firms were based primarily on quota achievement, commissions, and bonuses for top-line sales", and "no component explicitly rewarded following up on marketing leads" Sabnis et al. (2013) ·
SCCL13-C2 - A Time allocation is the mechanism: "the proportion of time that sales reps devote to marketing leads depends on organizational lead prequalification" Sabnis et al. (2013) ·
SCCL13-C5 - A Nonlinear pay gives salespeople and executives "incentive to manipulate prices, influence the timing of customer purchases, and vary effort over their firms' fiscal years" oyer-1998-fiscal-year-ends ·
OYER98-C1 - A The panel, verbatim: "A total of 31,936 quarterly observations are available, covering 981 manufacturers", and the data "cover firms' 1985 to 1993 fiscal years" oyer-1998-fiscal-year-ends ·
OYER98-C4 - A The author bounds his own result: "This analysis is not meant to determine the optimal compensation plan, to esti"mate structural parameters or to establish an indisputable causal relationship, and "the evidence on the link between incentive contracts and fiscal-year effects is circum"stantial oyer-1998-fiscal-year-ends ·
OYER98-C5
Grades: A, verified against the printed page of the primary source · B, primary source, text layer only · C, authoritative secondary · D, reported.
Related exhibits
-
The compensation diagnosis
From the essay A compensation plan can reward the coverage problem it created
-
The quota-parent matrix
From the essay Quota attainment has more than one parent
-
The synthetic marketing-to-sales handoff contract
From the essay What is a marketing-to-sales handoff? The interface where attribution breaks