← Every exhibit
Two ratios, read off your own billing data
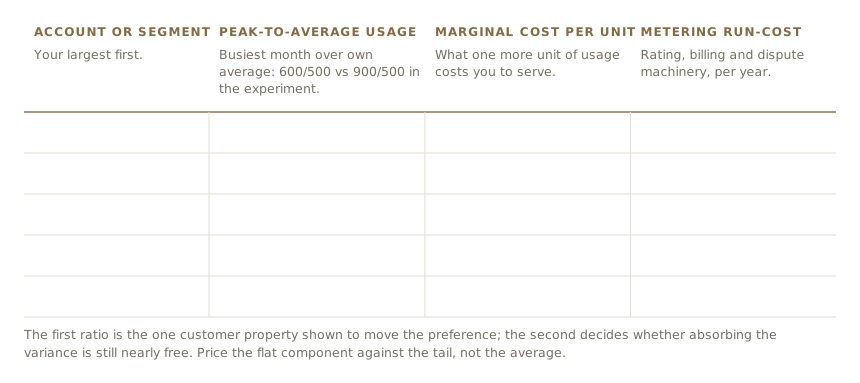
One row per key account or segment, from data you already hold. The first ratio is the buyer’s property; the second is the seller’s test of whether the theorem’s world is still yours.
Reference & Evidence
Source: Author's own worksheet.
Related exhibits
-
The preference at equal money, and what a premium does to it
From the essay A flat rate buys your customer’s worst month.
-
Same average, different tail
From the essay A flat rate buys your customer’s worst month.
-
The two plan-choice errors are not the same size
From the essay A flat rate buys your customer’s worst month.