← Every exhibit
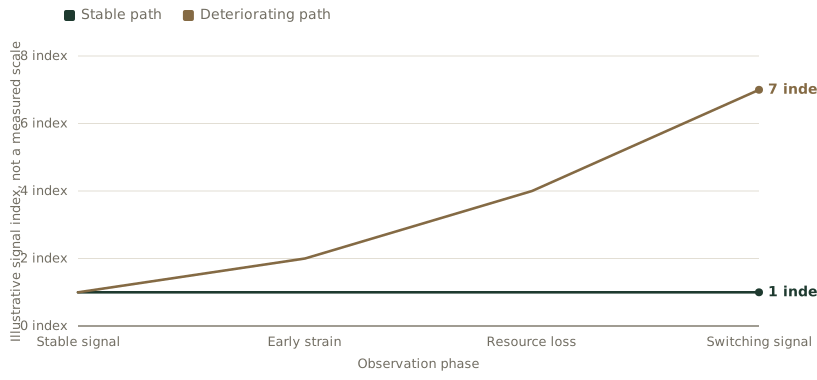
A path can move before churn is recorded
The endpoint label can remain unchanged while the path changes. The lines are an illustrative timing model, not a prediction of churn.
Reference & Evidence
Source: Author-generated illustrative model. Stable path values are [1, 1, 1, 1]; deteriorating path values are [1, 2, 4, 7] across four observation phases. The index has no empirical unit and is not a customer score.
Related exhibits
-
The revealed-preference choice record
From the essay What is revealed preference? Observed choice is not willingness to pay
-
A synthetic revenue-leakage reconciliation ledger
From the essay What is revenue leakage? The gap between promised and collected revenue
-
The objects behind preferred customer treatment
From the essay Preferred customer treatment is relative resource allocation