← Every exhibit
Equal coverage, different expected value
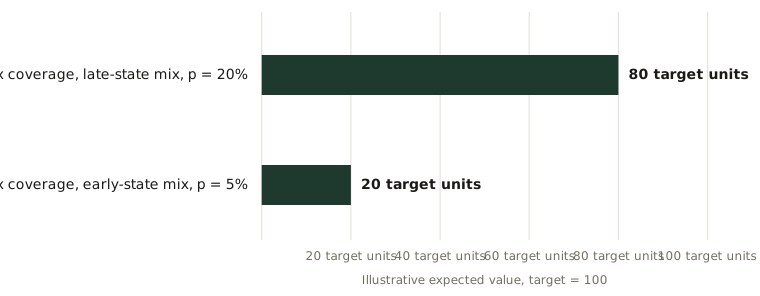
Both synthetic pipelines show 4x coverage. The expected values differ only because the declared conversion assumptions differ. The model is not a company forecast.
Reference & Evidence
Source: Author-generated transparent model. Target = 100 units; pipeline value = 400 units in both cases; Pipeline A probability = 20%; Pipeline B probability = 5%; expected value = pipeline value multiplied by probability. Values are illustrative, not a market benchmark.
Related exhibits
-
The denominator sensitivity of sales velocity
From the essay Pipeline coverage hides a conversion distribution
-
The synthetic forecast-override audit
From the essay What is a forecast override? Judgment is an intervention in the data
-
The synthetic forecast-category state table
From the essay What are forecast categories? Names need stable decision rules