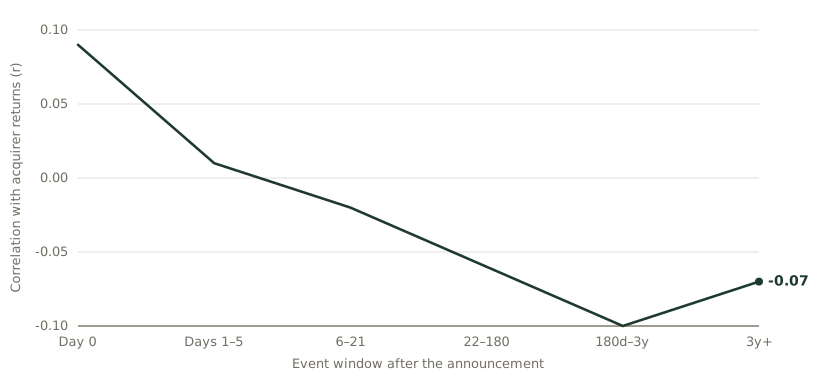
The base rate, drawn: acquirer returns drift negative
Across 93 studies, the acquirer's measured return starts at 0.09 on announcement day and drifts to −0.10 by three years. A base rate computed on share prices: it never observed the commercial decisions in front of you.
Reference & Evidence
Source: King, Dalton, Daily & Covin (2004), Table 1: estimated population correlations with acquirer abnormal returns, 26 to 127 effect sizes per window, n up to 28,016, across 93 studies. Day 0 and the three windows from 22–180 days onward are significant; days 1–5 and 6–21 are not. Outcomes are the market's verdict on the buyer: nothing here observed retention or cross-sell.
Each line is a claim from the register this journal publishes against, resolved from the register at build time.
- A Across the meta-analysis, "acquiring firms' performance does not positively change as a function of their acquisition activity, and is negatively affected to a modest extent" (p. 187, abstract) King, Dalton, Daily & Covin (2004) · VoR held, Marquette deposit of the typeset article ·
KDDC04-C1 - A Acquirer abnormal returns by event window (estimated population r): Day 0 0.09\\\ (127 effect sizes, n = 28,016) · Days 1–5 0.01 (114; 19,269) · Days 6–21 −0.02 (54; 8,548) · Days 22–180 −0.06\\\ (64; 5,698) · 180 days to 3 years −0.10\\\ (103; 25,205) · beyond 3 years −0.07\\\ (26; 5,966) (Table 1) King, Dalton, Daily & Covin (2004) · VoR held, Marquette deposit of the typeset article ·
KDDC04-C4
Grades: A, verified against the printed page of the primary source · B, primary source, text layer only · C, authoritative secondary · D, reported.
Related exhibits
-
The sign is a decision: the tested splits
From the essay The integration plan spends what the deal bought.
-
The measurement, and the traps it must survive
From the essay The integration plan spends what the deal bought.
-
The four foundational workstreams of post-merger integration
From the essay What is post-merger integration? M&A operational execution, synergy capture, and governance